|
ETFs are a popular investment vehicle for investors who want exposure to a simple underlying asset like an equity index or a commodity. At the time of writing, the United States Oil Fund (USO) is the 8th most traded ETF in the world, with assets under management of $2.8 billion and average daily volume of 28.5 million shares. However, investors that buy into USO hoping for exposure to the price performance of crude oil are in for a nasty shock. The below chart shows the relative performance of the front month benchmark WTI Crude Oil contract (CL on NYMEX) and the USO ETF. 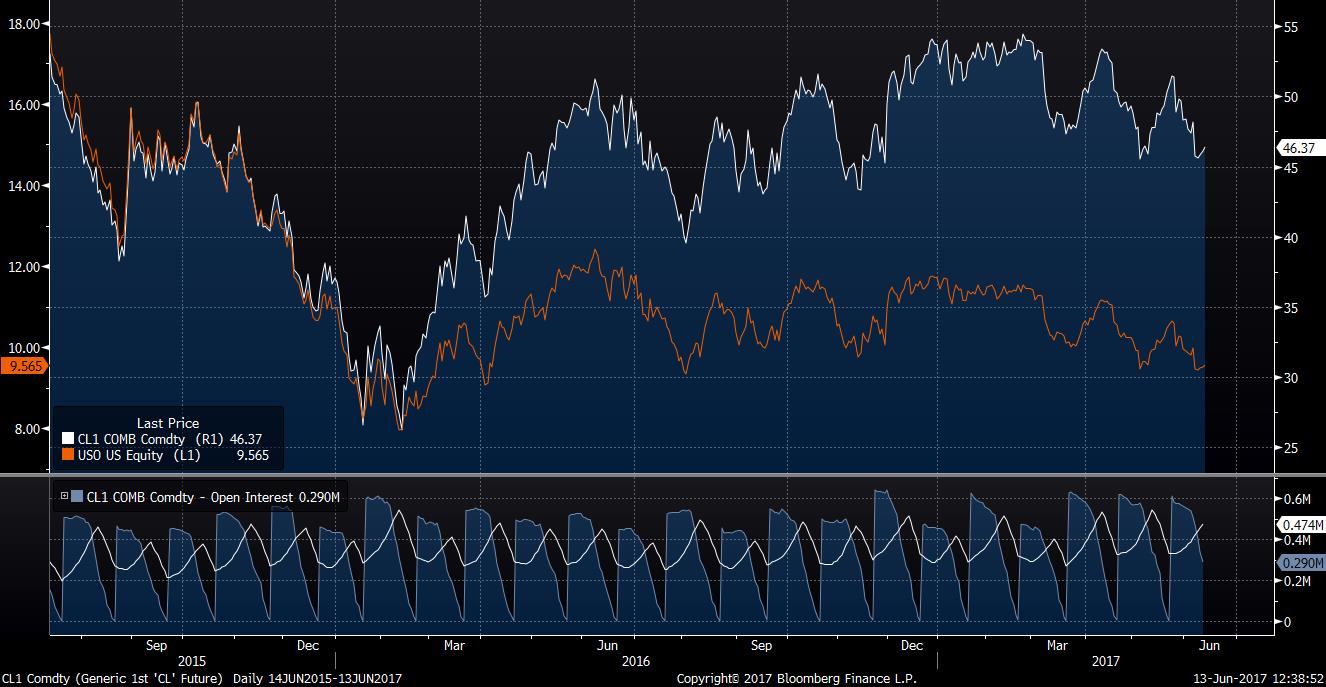 From a low of $26 in Feb 2016, the price of crude oil has recovered to $46, or an increase of 77%. USO on the other hand, from a low of $8, has increased to $9.5, only 19%. Why the massive discrepancy? To answer this question, we must dig in to exactly how USO gains exposure to the price of oil. The ETF manager does not simply buy barrels of oil and put them in storage. From the USO website: "USO invests primarily in listed crude oil futures contracts and other oil-related futures contracts..." "USO's Benchmark is the near month crude oil futures contract traded on the NYMEX..." www.uscfinvestments.com/uso Now we're getting somewhere. The benchmark WTI NYMEX contract (CL) lists expiry dates every month. Under normal market conditions the crude oil market is in contango. This means that contract dates further in the future are priced higher than near term contracts. The current front-month contract, July 2017, is trading at $46.30 while the next contract, August 2017, is trading at $46.50, a premium of $0.20. USO tracks the front-month performance by buying and selling July futures as demand for the ETF rises and falls. However, when the July contract expires, the ETF must roll their holdings into the next month. This means that they must sell July contracts, and simultaneously purchase the same number of August contracts at a premium of $0.20. Every time the ETF manager rolls the position they take a loss equal to the premium, every single month.
For short term traders the contract roll is not an issue. The stated purpose of USO is to track the daily percentage changes in crude oil prices, and so long as the same contract month is bought and sold this objective is met. "The investment objective of USO is for the daily changes in percentage terms of its shares' NAV to reflect the daily changes in percentage terms of the spot price of light, sweet crude oil..." However, investors taking a long term view on the price of oil pay away the roll premium every month. This is the cause of the massive discrepancy when comparing the performance of CL and USO. The CL chart displayed above is actually a composite of different front-month contracts stitched together. Alternatives solutions are buying a single futures contract with a longer expiry date, or physical barrels of oil. However both of these approaches present capital requirements and logistical costs that the average ETF investor seeks to avoid. Buyer beware, mind the futures roll gap when trading commodity ETFs.
0 Comments
Over the past four years, Electric Vehicle sales in the US have grown at a rate of 32%/year. In 2016 total sales amounted to 159k vehicles. Worldwide sales in 2016 grew 41% year over year. 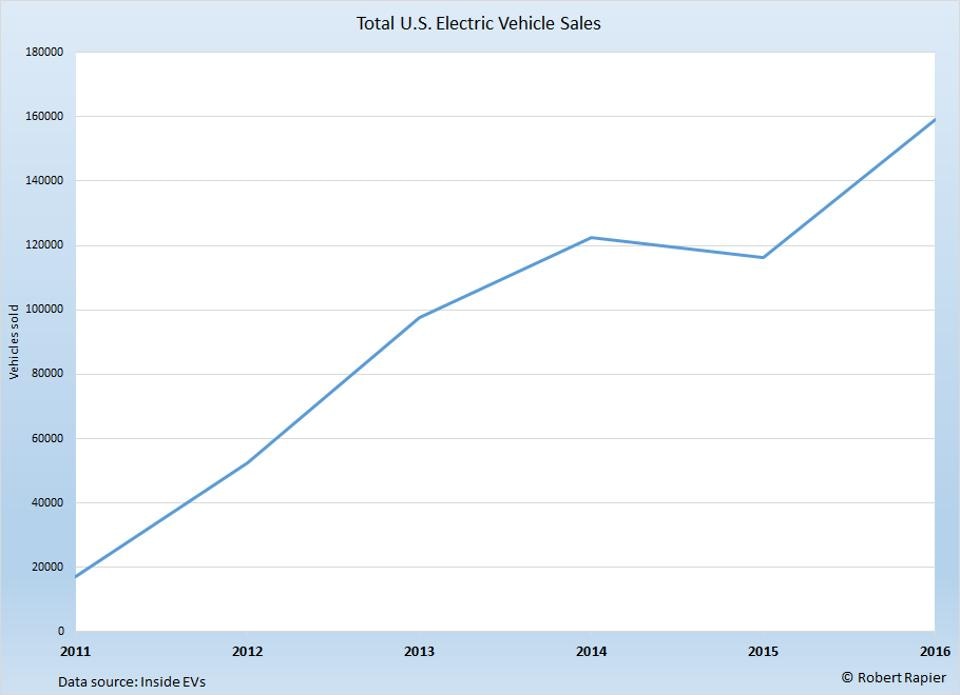 As EVs increasingly become a fixture in the modern world, it is worth taking a look at demand for the raw materials that go into them. The current Tesla Model S battery back is composed of a series of 16 modules. Each module is composed of 444 individual lithium-ion batteries strung together. Lithium-ion is the same type of battery that goes into the Tesla Powerwall, along with many laptop computers and mobile phones. Lithium-ion batteries are lightweight, rechargable, and have high energy density. Where Does Lithium Come From?Most of the world’s supply of Lithium comes from a region high in the Andes mountains near the intersection of Chile, Argentina, and Bolivia. Lithium filled brine is extracted from underground sources and then condensed through solar evaporation in large open-air pools. 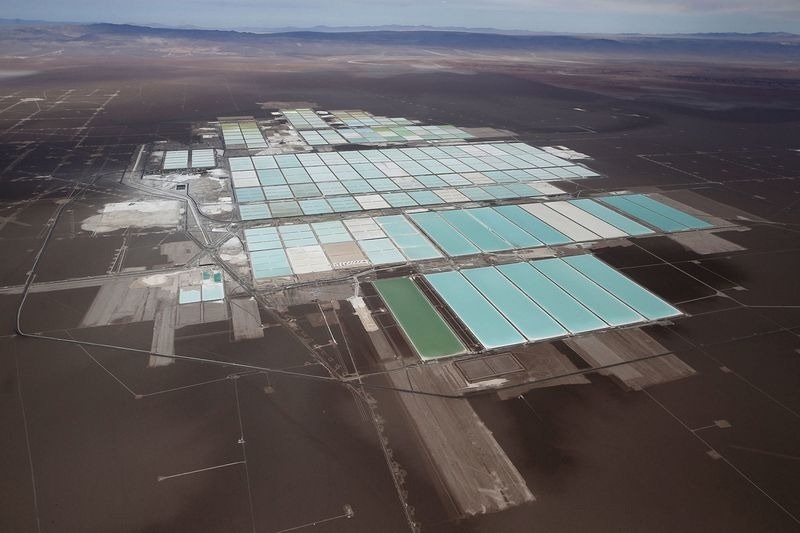 More recently American and Canadian companies have begun mining for Lithium in the remote Clayton Valley region of Nevada. Albermarle is the most established player and only active mine in North America, but Lithium X Energy Corp and Pure Energy Minerals have recently leased thousands of acres of land with prospective Lithium deposits. The companies are scrambling over the right to supply raw Lithium to the nearby Tesla Gigafactory in Sparks, NV. Bloomberg ran an informative article on the “Lithium Rush” back in March 2017: https://www.bloomberg.com/news/features/2017-03-29/the-great-nevada-lithium-rush-to-fuel-the-new-economy DemandBoth Deutsche Bank and Macquarie predict a 60 - 200% increase in demand for Lithium over the next decade, and prices rising by up to 50%. Indeed, the price of Lithium per metric ton has risen from $4,000 in 2014 to over $9,000 in 2017. As demand for Electric Vehicles and battery storage increases, suppliers are scrambling to keep pace with demand. 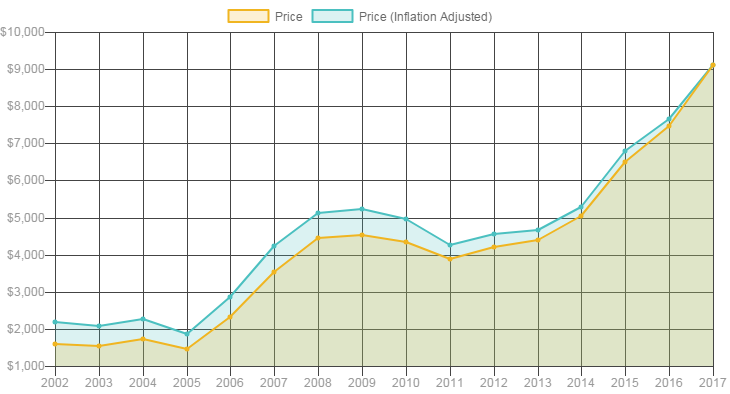
|
Poloniex |
Coinone |
Kraken |
Bithumb |
OKCoin |
Huobi |
GDAX |
Bitfinex |
xBTCe |
Bittrex |
What is interesting about this list is the global distribution. The only major American exchanges that appear are Kraken and GDAX, and Kraken caters primarily to European customers. A few months ago the rapid rise in Bitcoin prices was attributed to buying by Chinese customers, and we see two of the largest Chinese exchanges, OKCoin and Huobi, on the list.
But recent price gains have been caused primarily to South Korean and Japanese interest, and indeed the major Korean exchanges Coinone and Bithumb occupy numbers 2 and 4 on the list. With crypto liquidity spread across so many exchanges and geographies the question naturally arises, are the prices inline? Or is there an opportunity for arbitrage between the exchanges?
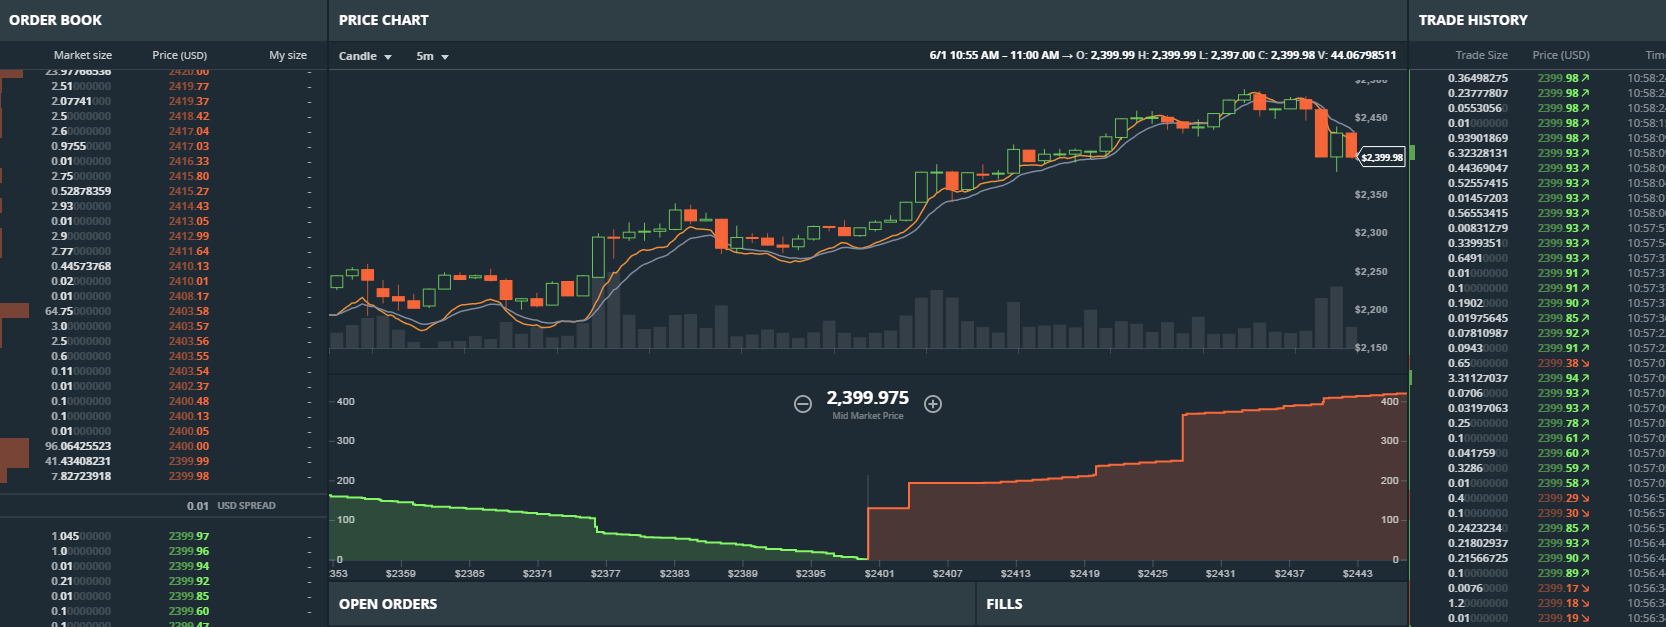
At the time of writing, the last trade price of BTC on GDAX was 2,399.98 USD:
But recent price gains have been caused primarily to South Korean and Japanese interest, and indeed the major Korean exchanges Coinone and Bithumb occupy numbers 2 and 4 on the list. With crypto liquidity spread across so many exchanges and geographies the question naturally arises, are the prices inline? Or is there an opportunity for arbitrage between the exchanges?
At the time of writing, the last trade price of BTC on GDAX was 2,399.98 USD:
At the same time on Korbit (a top 4 South Korean exchange) Bitcoin was trading at 3,102,000 KRW:
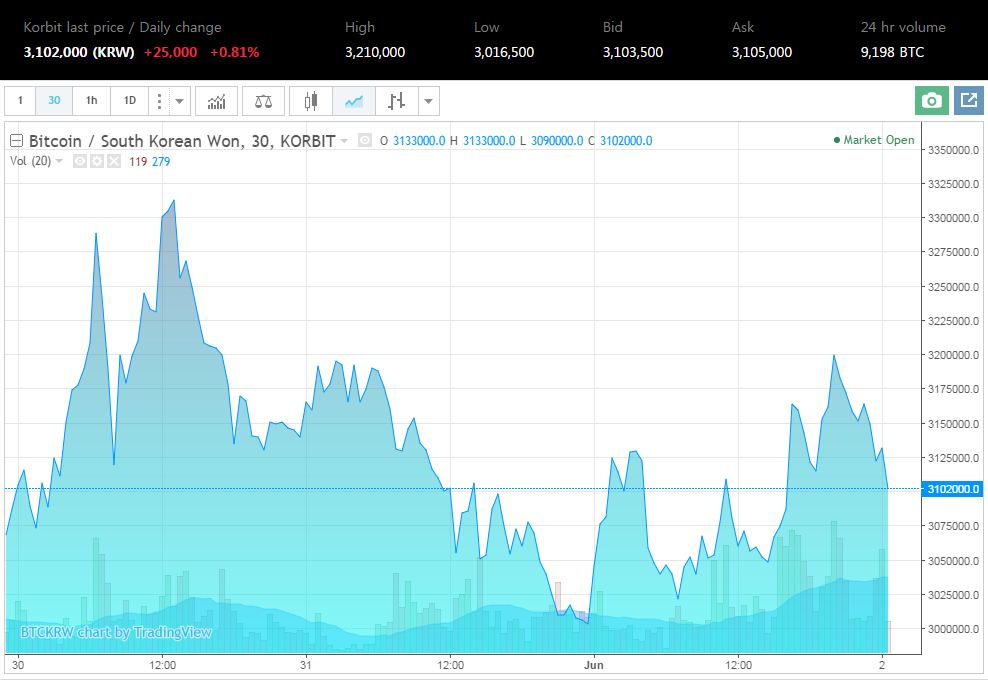
At an exchange rate of 0.00089 USD per KRW, this translate to a BTC price of $2,765, an arbitrage of $365.
$365 is more than sufficient to cover exchange execution fees, withdrawal fees, and FX transaction fees, which together amount to a few hundred basis points (at most). The problem an American investor would face attempting to execute this trade would be opening a KRW bank account in South Korea. Most South Korean banks require you to appear at the bank in person with your passport and valid visa to open a bank account. Online transactions are mostly unavailable (see transferwise.com/us/blog/opening-a-bank-account-in-south-korea).
An interesting alternative to trading Bitcoin in South Korea are the Japanese bitcoin exchanges. USDJPY is fully convertible and the second most traded pair in the world after EURUSD. Many global banks offer accounts denominated in JPY.
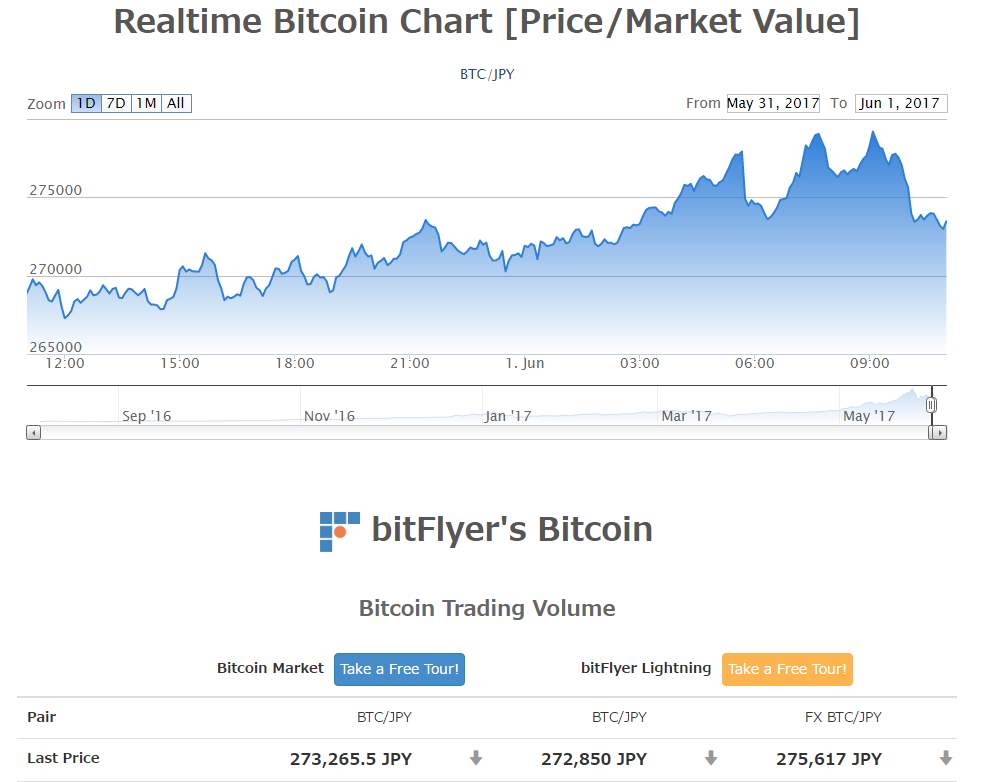
At the same time BTC was trading around $2,399.98 on GDAX, on BitFlyer (a major Japanese BTC exchange) the price was 273,265.5 JPY. This translates to $2,454.86, an arbitrage of $55. Although not as attractive as the South Korean premium, it is still more than sufficient to cover trading costs and reflects the large demand for BTC in Japan. As with any arbitrage strategy the devil is in the details, and the trader will need to decide if the administrative difficulty of arranging the accounts and cross-border payments is worth it for an opportunity that may prove to be short-lived.
Jeff Senk
-Instructor at How Markets Work
-Founder of the Automated Trading Group at Techemet Metal Trading
 RSS Feed